Do you want to keep track of scrub encroachment, or visualise the extent of new hedgerows in the cluster area? Maybe you want to show how the area of a certain wildlife habitat has been increased? These can all be shown with “before and after” type monitoring.
Before and after!
- Measure area of features over time – for example, a farmer cluster went from having 50ha of pollen & nectar mix in 2018 to 130ha in 2022. You can do this using farm records, stewardship agreements, drawing areas on paper maps, Geographic Information Systems (GIS) or the Land App.
- Record new features over time – for example, there were 3 wader scrapes in the farmer cluster in 2018, increasing to 14 in 2022.
- Using aerial imagery (e.g. drone): take before and after shots of a given area where habitat improvements are being made. You can also use ground landscape photos or panoramas. These are sometimes required for Countryside Stewardship options anyway, to document a new feature such as a hedge!
- Monitor habitat succession and changes using the same technique as above – for example, to measure encroachment of gorse or bracken on heathland. Make sure that measurements are always made at the same time of year for comparability.
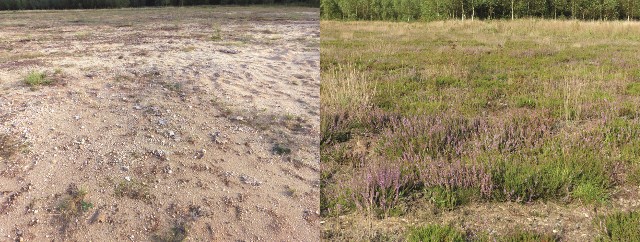
Heathland restoration before and after © E.R.J Wubs
Plant surveys
Plants make up the majority of habitats that we try to encourage on farmland. To survey plants, you will need some identification skills, but these can be basic, or targeted towards recognising one or two important species. Quadrat sampling is a great way to measure incremental progress in plant species richness.
Quadrats allow us to sample a representative amount of a big area of habitat. They are a simple square frame made of cane or similar material, 50x50cm or 1x1m in size. These are initially placed either at random in the survey area or according to a fixed grid pattern. The locations must be marked to allow resurveying of the same points in following years (which is where the grid pattern scores, because survey points can be determined by measurement along compass directions from a central marked point).
Plants falling within the area of the quadrat are identified, counted or the area covered by each species evaluated (by eye) to the nearest 5%. This works best on meadows, grassland, heath, marsh and woodland floor, but could also be used to gauge species-richness of arable field margins or cultivated plots for arable flora.
How many quadrats you survey is up to you, but 5 is a minimum for a given habitat block. Data from multiple quadrats can be averaged, and extrapolated up. Quadrat sampling can help to show trends and answer the following types of queries:
- Has the species richness of my grassland changed since I stopped using fertiliser?
- Has the number of cowslips increased since switching from spring to autumn grazing?
- Is the percentage cover of a given species increasing – such as heather on a moor, or rushes on floodplain grazing?
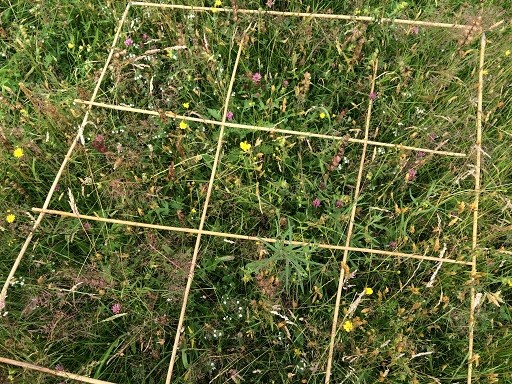
A quadrat survey on a species-rich meadow © Plantlife